plotTrees - Plot a tree with colored internal node labels using ggtree
Description
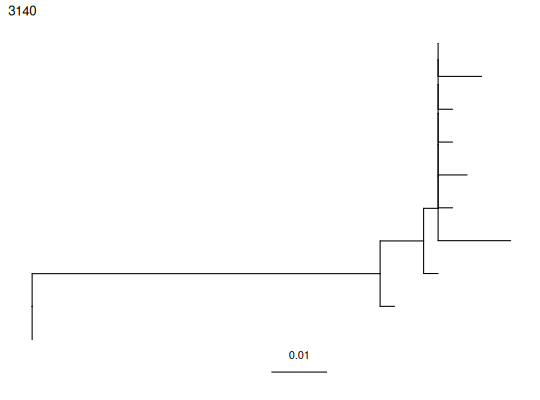
plotTrees plots a tree or group of trees
Usage
plotTrees(
trees,
nodes = FALSE,
tips = NULL,
tipsize = NULL,
scale = 0.01,
palette = "Dark2",
base = FALSE,
layout = "rectangular",
node_nums = FALSE,
tip_nums = FALSE,
title = TRUE,
labelsize = NULL,
common_scale = FALSE,
ambig = "grey",
bootstrap_scores = FALSE,
tip_palette = NULL,
node_palette = NULL
)
Arguments
- trees
- A tibble containing
phyloandairrCloneobjects - nodes
- color internal nodes if possible?
- tips
- color tips if possible?
- tipsize
- size of tip shape objects
- scale
- width of branch length scale bar
- palette
- color palette for tips and/or nodes. Can supply a named vector for all tip states, or a palette named passed to ggplot2::scale_color_brewer (e.g. “Dark2”, “Paired”, “Set1”) or ggplot2::scale_color_distiller (e.g. RdYlBu) or
- base
- recursion base case (don’t edit)
- layout
- rectangular or circular tree layout?
- node_nums
- plot internal node numbers?
- tip_nums
- plot tip numbers?
- title
- use clone id as title?
- labelsize
- text size
- common_scale
- strecth plots so branches are on same scale? determined by sequence with highest divergence
- ambig
- How to color ambiguous node reconstructions? (grey or blend)
- bootstrap_scores
- Show bootstrap scores for internal nodes? See getBootstraps.
- tip_palette
- deprecated, use palette
- node_palette
- deprecated, use palette
Value
a grob containing a tree plotted by ggtree.
Details
Function uses ggtree functions to plot tree topologlies estimated by
getTrees, and findSwitches. Object can be further modified with
ggtree functions. Please check out
https://bioconductor.org/packages/devel/bioc/vignettes/ggtree/inst/doc/ggtree.html and
cite ggtree in addition to dowser if you use this function.
Examples
data(ExampleClones)
trees <- getTrees(ExampleClones[10,])
plotTrees(trees)[[1]]